The default “Top Opportunities” Chart is fine, but if you prefer to see the detailed revenue for each Opportunity, follow these instructions. (Scroll to the bottom to check out the finished chart!)
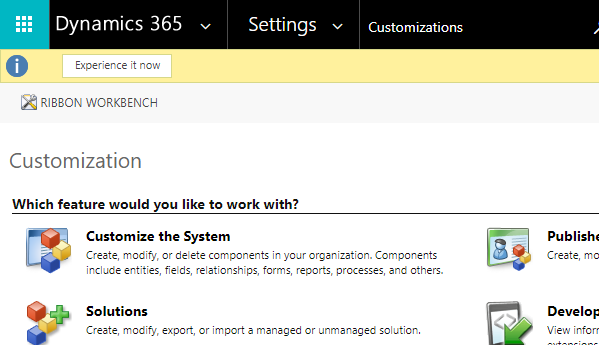
Navigate to Settings->Customizations->Customize the Solution:
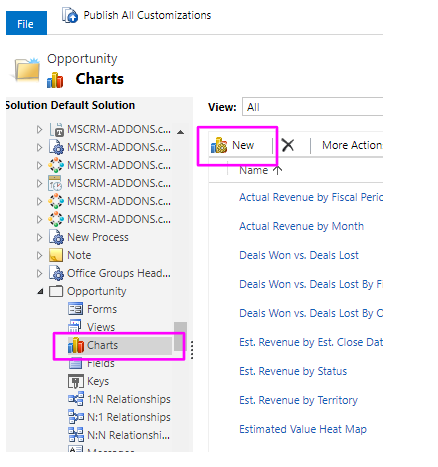
Head over to the Opportunity Entity and select Charts, then New:
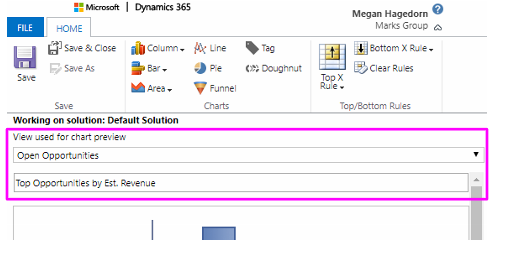
Select the view to be used for the chart preview first and give the Chart a name:
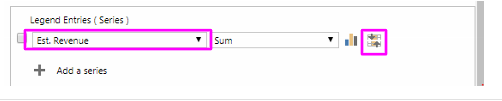
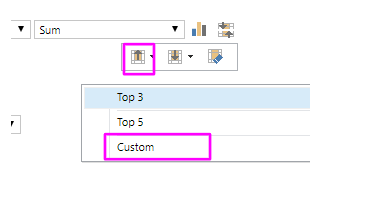
Select Est. Revenue, then select the Top/Bottom Rules button:
Select Top X Rule, then Custom (to get the top 10):
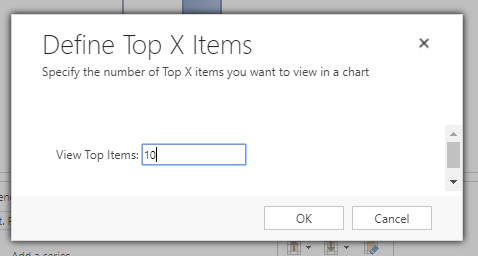
Enter 10 and click OK:
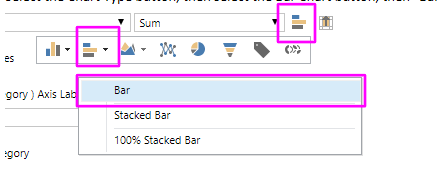
Select the Chart Type button, then select the Bar Chart button, then “Bar”:
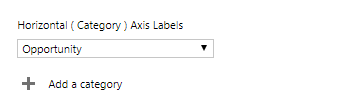
Select “Opportunity” or whatever field you like for the Horizontal Axis:
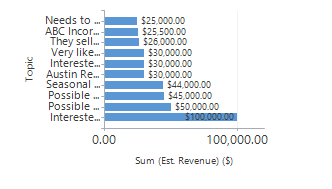
Save and Close the window, then Publish Your Customizations. This creates a chart that shows the detailed Est. Revenue for each of the Top 10 Opportunities for the selected View:
You can add this chart to whatever Dashboard you like by heading over to Customize Your Solution->Dashboards.