Catch your eye with that title? Well, we’ll try our best here and see what we can do with charts in lightning. Reason I picked this one was solely because while I was creating a chart last month, I noticed that there’s a setup area now with charts that allows you to do a lot more with lightning charts.
The major difference I notice right away is that when I’m viewing a report, I can change the chart right within the report (the gear icon on the right) as opposed to in classic, I have to go to “customize” then I can edit the chart there.
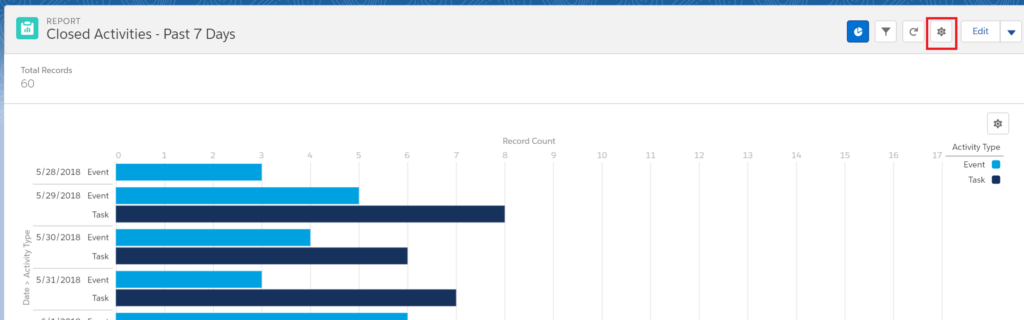
When I click that gear icon, very different screen from before.
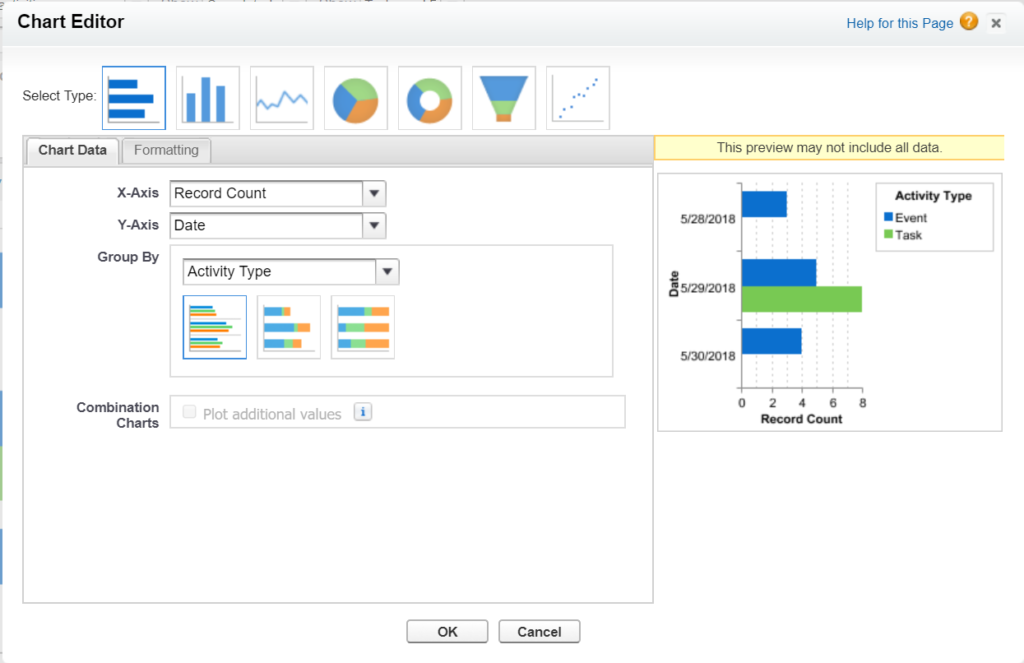
Here’s the old customize page:
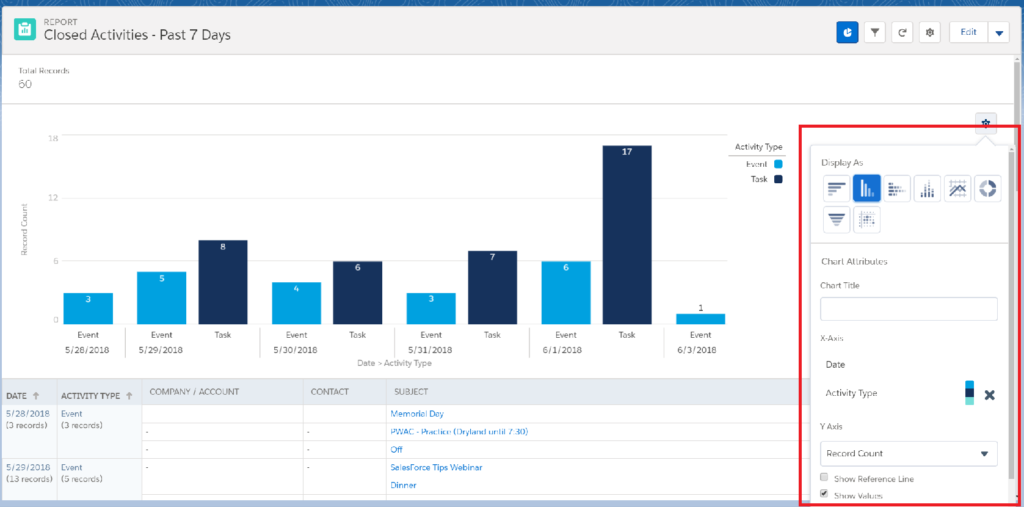
Thing is, when I click the different formats, because lightning is so much more dynamic, you can edit and see the changes as reflected in the chart right away as opposed to trial and error in classic. Frankly, the formatting options are probably the same, I just find the real time changes to be so much more effective when it comes to the reporting and charting in SF.
Adding things like reference lines to charts, seeing the values on each bar, moving the legend, etc. — just a time saver so I can see it all before hitting save.